
Tag: trade
Engineer admits he stole trade secrets while working on the Apple Car


Xiaolang Zhang has pled guilty to stealing trade secrets from Apple, where he worked on a self-driving car project from 2015 to 2018 (via CNBC). When he quit his job at Apple, he told his supervisor that he was going to work for Guangzhou Xiaopeng Motors Technology, a Chinese EV startup also known as Xpeng.
During an investigation, which you can read more about here, Apple determined that he had transferred around 24GB of “highly problematic” data to his wife’s laptop via AirDrop, and had also taken circuit boards and a server from the company’s autonomous vehicle lab.
The terms of Zhang’s plea agreement aren’t publicly available, but according to a court document uploaded by CNBC (pdf), Zhang pled guilty to the single theft of trade…
EV startup Karma would like DeLorean to go back in time and not steal its trade secrets


The effort to electrify an iconic car has run into its first speed bump. Earlier this month, electric vehicle company Karma Automotive filed a lawsuit against DeLorean Motors Reimagined, the Texas-based company that holds the branding rights for the original DeLorean Motor Company (DMC), and four of its employees, alleging stolen intellectual property.
More broadly, Karma claims that DeLorean Motors Reimagined only exists because a joint venture between the two didn’t pan out. In a lawsuit filed on August 8th in US District Court for the Southern District of Texas, Karma alleges that four DeLorean employees — CEO Joost de Vries, COO Alan Yuan, vice president Neilo Harris, and chief marketing officer Troy Beetz — stole the company’s trade…
Market Structure: How To Identify And Trade Trending Market


One of the basic skills you’ll need as a trader is the ability to recognize the market structure, which is necessary for implementing efficient price action techniques in appropriate market conditions.
Because you will not trade all markets in the same manner, you must first study how they behave and how traders interact.
Market structure refers to the study of market behavior.
When you open your chart, you will be able to respond to these crucial questions if you can perfect this skill.
What’s everyone doing now? Who controls the market, buyers or sellers?
When should you enter or exit the market, and when should you stay away?
This post will teach you how to identify and trade trending markets.
Trending markets
The trending markets have a regular pattern of higher highs and higher lows in an up trending market and lower highs and lower lows in a down trending market.
Here’s an illustration:
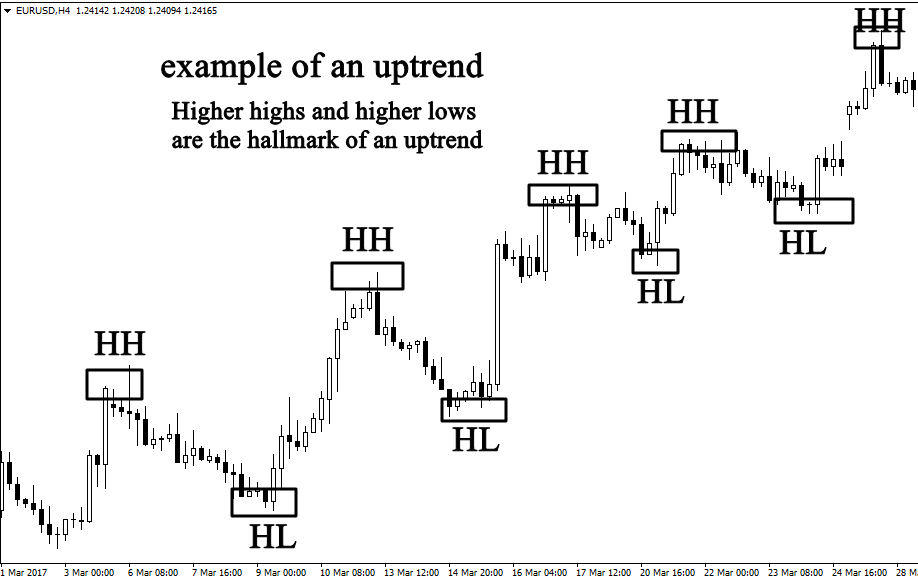
As seen in the above example, the market is uptrend since it creates successive higher highs and higher lows.
Observing price movement will give you a solid idea of the market trend; you don’t need indicators to tell whether the market is bullish or bearish.
Take a look at another example of a market that is on a downtrend.
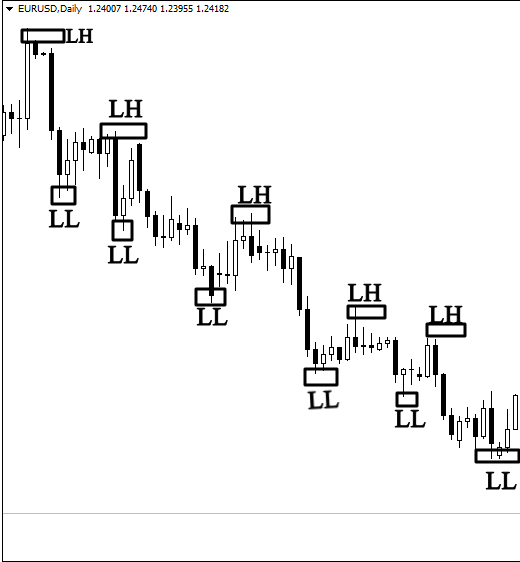
In the second example, the market is bearish; as shown, there have been numerous lower highs and lower lows, indicating a downtrend.
Trending markets are simple to spot; observe the market rather than attempting to complicate your analysis.
An uptrend market is making a series of higher highs and higher lows; on the other hand, a downtrend market is making a series of lower highs and lower lows.
Use larger time frames, such as the 4H, daily, or weekly, to evaluate whether a market is trending or not.
Avoid analyzing the market structure in short time frames.
How To Trade Trending Markets:
It will be simple for you to trade a trending market if you can recognize it.
If the market is bullish, you will search for a buying opportunity since you must follow the trend, and if the market is bearish, you will search for a selling opportunity.
But when is the best time to enter a trending market?
The impulsive and retracement moves are crucial movements in a trending market.
Look at the example below to grab what I mean.
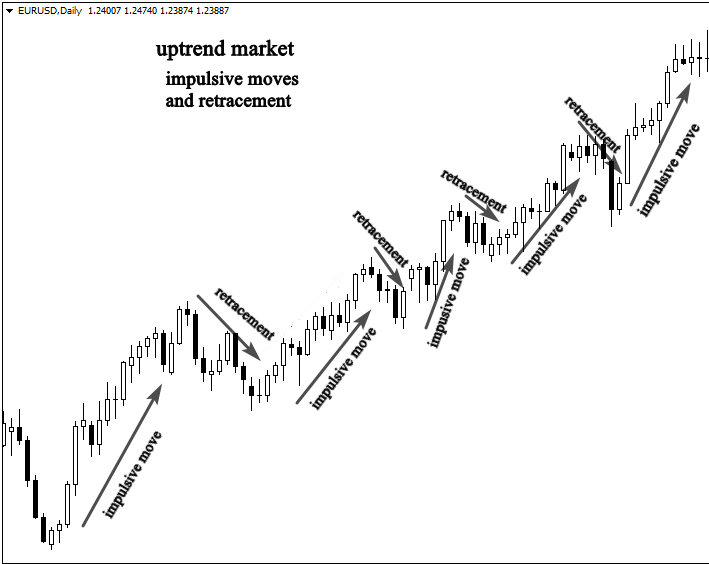
You can see that the market was creating higher highs and higher lows, which implies a bullish market.
If you witness this type of market, you should consider buying.
However, you can also see that the market was making two distinct movements.
The first is an impulsive move, and the second is a retracement move.
Professional traders understand the psychology behind trending markets; they always buy at the beginning of an impulsive move and sell at the end.
The market behaves impulsively in the trend’s direction before retracing and impulsively again.
Knowing how trending markets move will help you remember that the best time to buy is at the beginning of an impulsive move.
Traders who buy an uptrend market at the beginning of a retracement move get caught and left baffled as to why the market hit its stop loss before moving in the direction they had predicted.
See an example of a bearish trend.
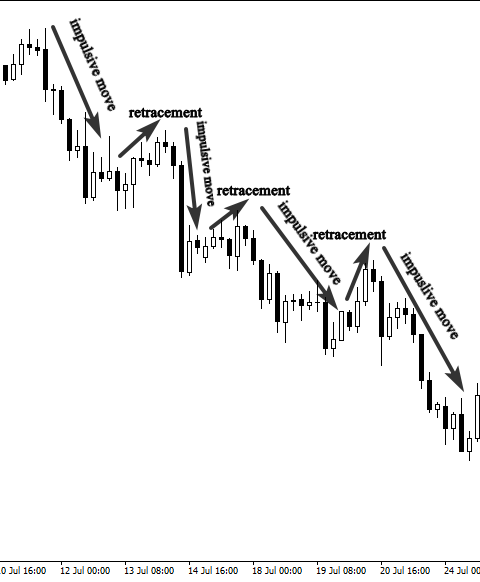
From the example above, which is a downtrend market, the ideal trading choice is to sell the market at the beginning of the impulsive move.
If you attempt to sell during the retracement move, you will be trapped by experienced traders and lose your trade.
Conclusion:
You can identify markets in an uptrend or downtrend now that you know the difference between an impulsive and retracement move.
Knowing this is crucial for you as a price action trader.
However, your question should be, “how do you spot the beginning of an impulsive move so you can enter the market with skilled traders and avoid getting trapped in a retracement move?”
You need to learn how to draw support and resistance levels if you want to predict the beginning of an impulsive move in a trending market.
I will discuss how to draw the support and resistance levels on your charts and what they are in my subsequent article.
Follow me on Twitter if you’re interested in articles like this and want to learn more about how you can invest in cryptocurrencies and trade them ethically.
Join Coinmonks Telegram Channel and Youtube Channel learn about crypto trading and investing
Also, Read
- 3Commas Review | Pionex Review | Coinrule review
- Ledger vs Ngrave | Ledger nano s vs x | Binance Review
- Crypto Trading bots | Bingbon Review
- Bybit Exchange Review | Bityard Review | Jet-Bot Review
- 3Commas vs Cryptohopper | Earn crypto interest
- SmithBot Review | 4 Best Free Open Source Trading Bots
- Coinbase Bots | AscendEX Review | OKEx Trading Bots
- How to buy Bitcoin in India? | WazirX Review
- Crypto Trading bots | Probit Review
- CryptoHopper Alternatives | HitBTC Review
- CBET Review | KuCoin vs Coinbase
Market Structure: How To Identify And Trade Trending Market was originally published in Coinmonks on Medium, where people are continuing the conversation by highlighting and responding to this story.
How to Trade the V-Shaped Bottom?


As the name suggests, V-shaped bottoms resemble a V-shaped price formation that forms when the price turns from an aggressive selling to an aggressive buying mode. This chart pattern calls for a trend reversal, but it can be hard to identify the V-bottom pattern in real-time due to the high volatility involved.
How to Trade V-Bottoms?
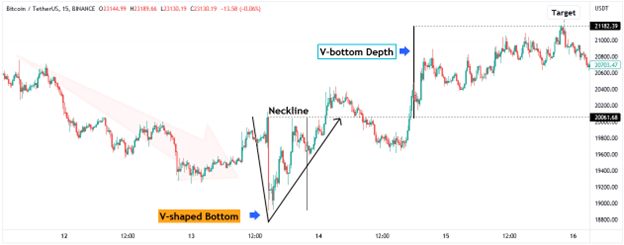
First, to have a trend reversal, we need to have a prevailing trend. In the case of a V-shaped bottom, the overall trend is bearish. One of the critical features of a V-bottom is the sharp angle of decline from that very strong bearish trend.
The second phase of the V-bottom is once the sellers capitulate and the buyers step in aggressively. This can be viewed on the price chart by the straight line price action to the upside that is more or less symmetrical to the first part of the pattern.
The reversal pattern is confirmed once the sharp decline has been completely reversed.
Buying and Exit
Buying can be done after a break and close above the neckline, which represents the starting point of the initial sharp decline. The exit point is typically equal to the distance measured from the bottom to the neckline high and projects the same price distance to the upside.
Alternatively, higher risk takers can be more aggressive and try to enter the market once the price has started moving to the upside.
Another essential thing to consider is whether the V-bottom is triggered by a news event. If there is a news catalyst behind the V-bottom pattern, the higher the probability that the cryptocurrency has marked a bottom.
Four tips when trading with the V-shaped bottom
When trading with the v-shaped bottom, it’s important to keep a few things in mind.
- First, you need to be patient and wait for the right opportunity.
- Second, you need to have a clear idea of where you want to get out before you enter the trade.
- Third, don’t be afraid to take some profits off the table when the trade starts to move in your favor.
- And finally, don’t forget to use stop losses to protect your profits.
Looking forward in the current bear market
Many investors are wondering how to trade the current bear market. The V-shaped bottom is a classic bear market pattern that typically happens after a major sell-off. The first thing to look for is a sharp V-shaped bottom with a quick bounce back up. This is followed by a period of consolidation where the market stabilizes. After this, the market typically resumes its downtrend.
Originally published at https://www.cryptohopper.com.
How to Trade the V-Shaped Bottom? was originally published in Coinmonks on Medium, where people are continuing the conversation by highlighting and responding to this story.