
If you’re a crypto investor, you most likely have suffered over the last few months. Not only has the crypto market entered a bear market, but many assumingly “safe” crypto projects such as Terra Luna, Celsius and Voyager went bankrupt and made all their investors lose a lot of money. However, in the recent weeks we saw a strong recovery of all cryptocurrencies. We at Crypto Hub have been analyzing the market for years and made the most profitable call any business could make — we called the absolute bottom. Here is how we found the bottom:

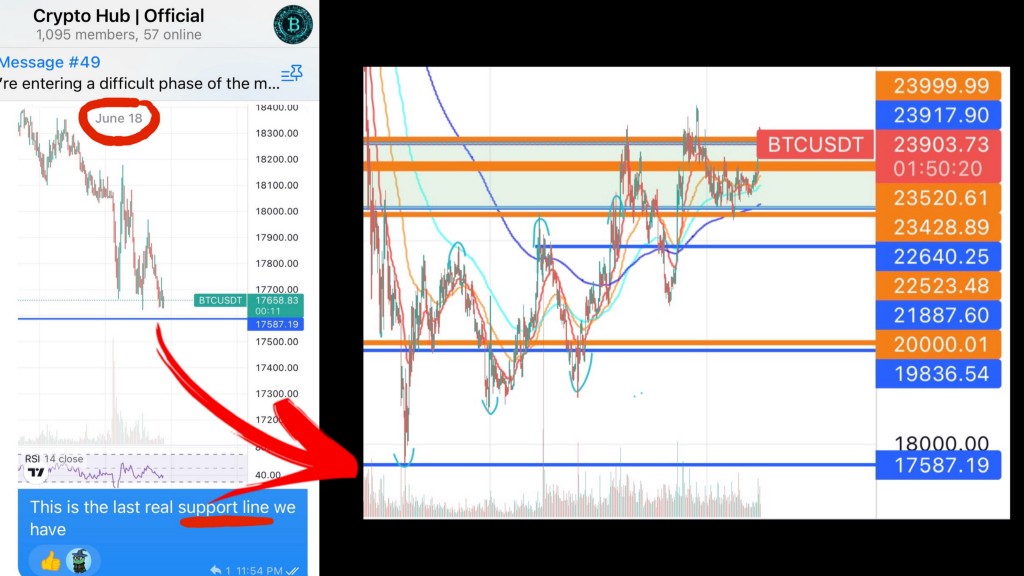
It’s June 18th, a day which will be written as one of the darkest days in crypto history and a day all investors wish to have invested in any crypto. On this day Bitcoin crashed -16% which caused massive liquidations and brought the market sentiment to an all-time low. This crash was caused by the collapse of the Terra Luna ecosystem and the fear of future interest rate hikes by the FED. Despite the negative market sentiment, our team at Crypto Hub saw light at the end of the tunnel and predicted the absolute bottom of Bitcoin and the whole crypto market. We looked on the following 2 indicators which with a high certainty have marked the bottom (Bitcoin: $17.6k).
1. Fear & Greed Index
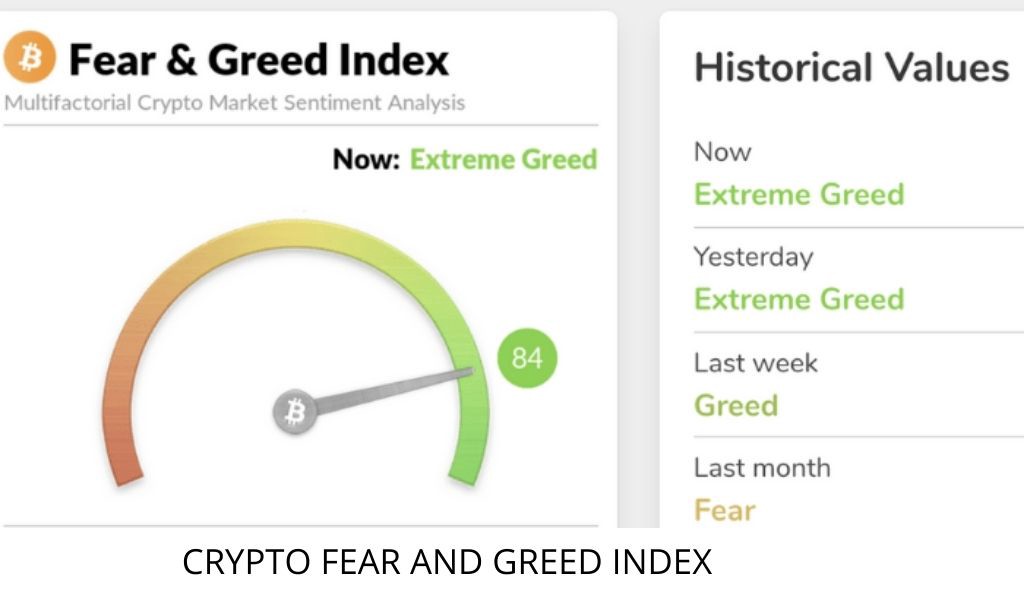
As we stated on Medium a few days before Bitcoin reached its bottom “People tend to get greedy when the market is rising and people react irrationally when the market is dropping”.
This is exactly what the Fear & Greed Index is measuring. It measure the overall emotional sentiment in the crypto market. When the market is at maximum fear, the index show the number 0 and when everybody in the market is greedy, the F&G index shows the number 100. On June 18th, the index showed the number 9, which is a historic low.
Given Warren Buffett’s famous quote “Be greedy when others are fearful and be fearful wen others are greedy” we concluded that buying crypto on the 18th of June of the best time according to the index.
2. RSI Indicator
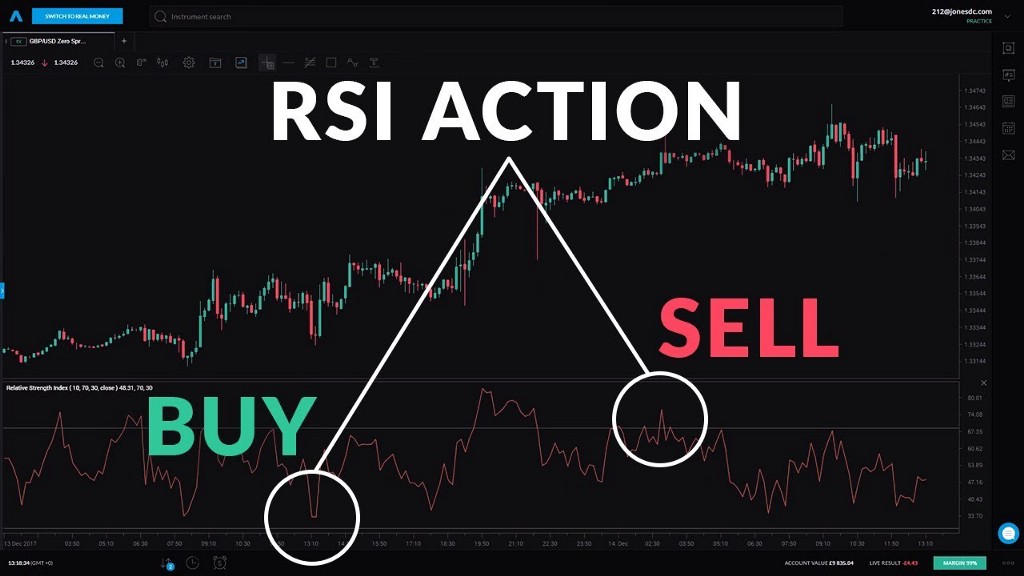
The RSI (Relative Strength Index) is a technical momentum indicator which measures the speed and magnitude of an asset’s recent price changes.
The RSI basically indicates whether an asset is oversold or overbought. When the number of the RSI is below 50 it shows that the asset is oversold and below 30 it indicates that it’s in a extremely oversold territory. On June 18th, Bitcoin was hovering between 26 and 27 points which according to the RSI mean it’s very oversold.
Since many whales use this indicator for their trading, we concluded that the RSI at 26 points means many traders will invest regardless of the negative market sentiment. Gladly, we did invest and gave a buying signal in our group, as currently the RSI for Bitcoin shows the number of 61 points (neutral)
👋Business Requests: Telegram: Contact @cryptohubtiktok
💰Feel free to Follow Us for more such analyses
🐦Also check out our Twitter Account for shorter analysis
🤑Join our Telegram channel to interact with like-minded people
🌟Subscribe to our YouTube channel for daily Crypto-related videos
Join Coinmonks Telegram Channel and Youtube Channel learn about crypto trading and investing
Also, Read
- Best Bitcoin Margin Trading| Bityard Margin Trading
- Crypto Margin Trading Exchanges | Earn Bitcoin
- WazirX vs CoinDCX vs Bitbns | BlockFi vs CoinLoan vs Nexo
- BlockFi Credit Card | How to buy Bitcoin on Binance
- Huobi Trading Bot | How to buy ADA | Geco.One Review
This Is How We Found The Absolute Crypto Bottom! was originally published in Coinmonks on Medium, where people are continuing the conversation by highlighting and responding to this story.